Fiscal Scorecard Each year, CPS rates all charter schools on several key metrics of financial health. Our school’s most recent available scorecard is linked here:
Annual Budget Our fiscal year starts on July 1 and ends on June 30 of the following year. Our most recently completed fiscal year was FY24, which ended on June 30, 2024.
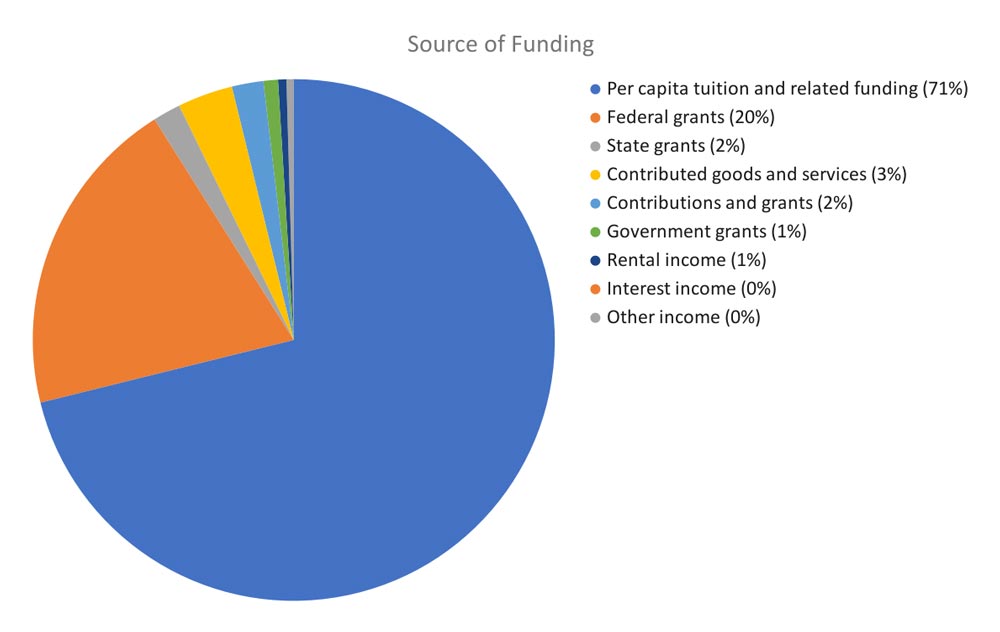
Sources of Funding The chart below illustrates the breakdown of Aspira’s revenue streams for FY24. Approximately 93% of our funding comes from public sources, city, state, and federal. Primarily determined by per-pupil allocations and our student poverty index. An additional 3% come from goods and services provided by CPS. About 3% is generated through grants and programs for our Youth Development. The remaining 1% is generated from student fees and other miscellaneous sources.
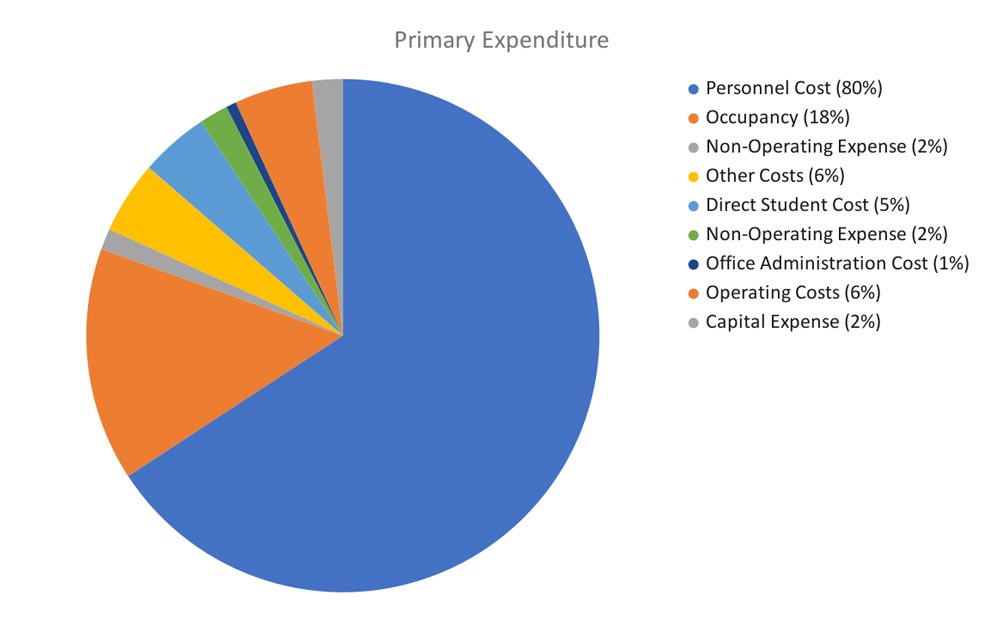
Primary Expenditures The pie chart and description below break down how we spent our funds in FY24.
66% Personnel costs – include salaries, benefits, and payroll taxes.
15% Occupancy – include facilities, utilities, etc.
5% Operating costs – include contracts and professional services.
4% Other costs – include communications, sponsorship, etc.
4% Direct student costs – include educational expenses, programs, activities, and transportation.
2% Capital expenses – include leases and equipment.
2% Non-operating expenses – include interests and fees.
1% Office administration – include office expenses and supplies.